
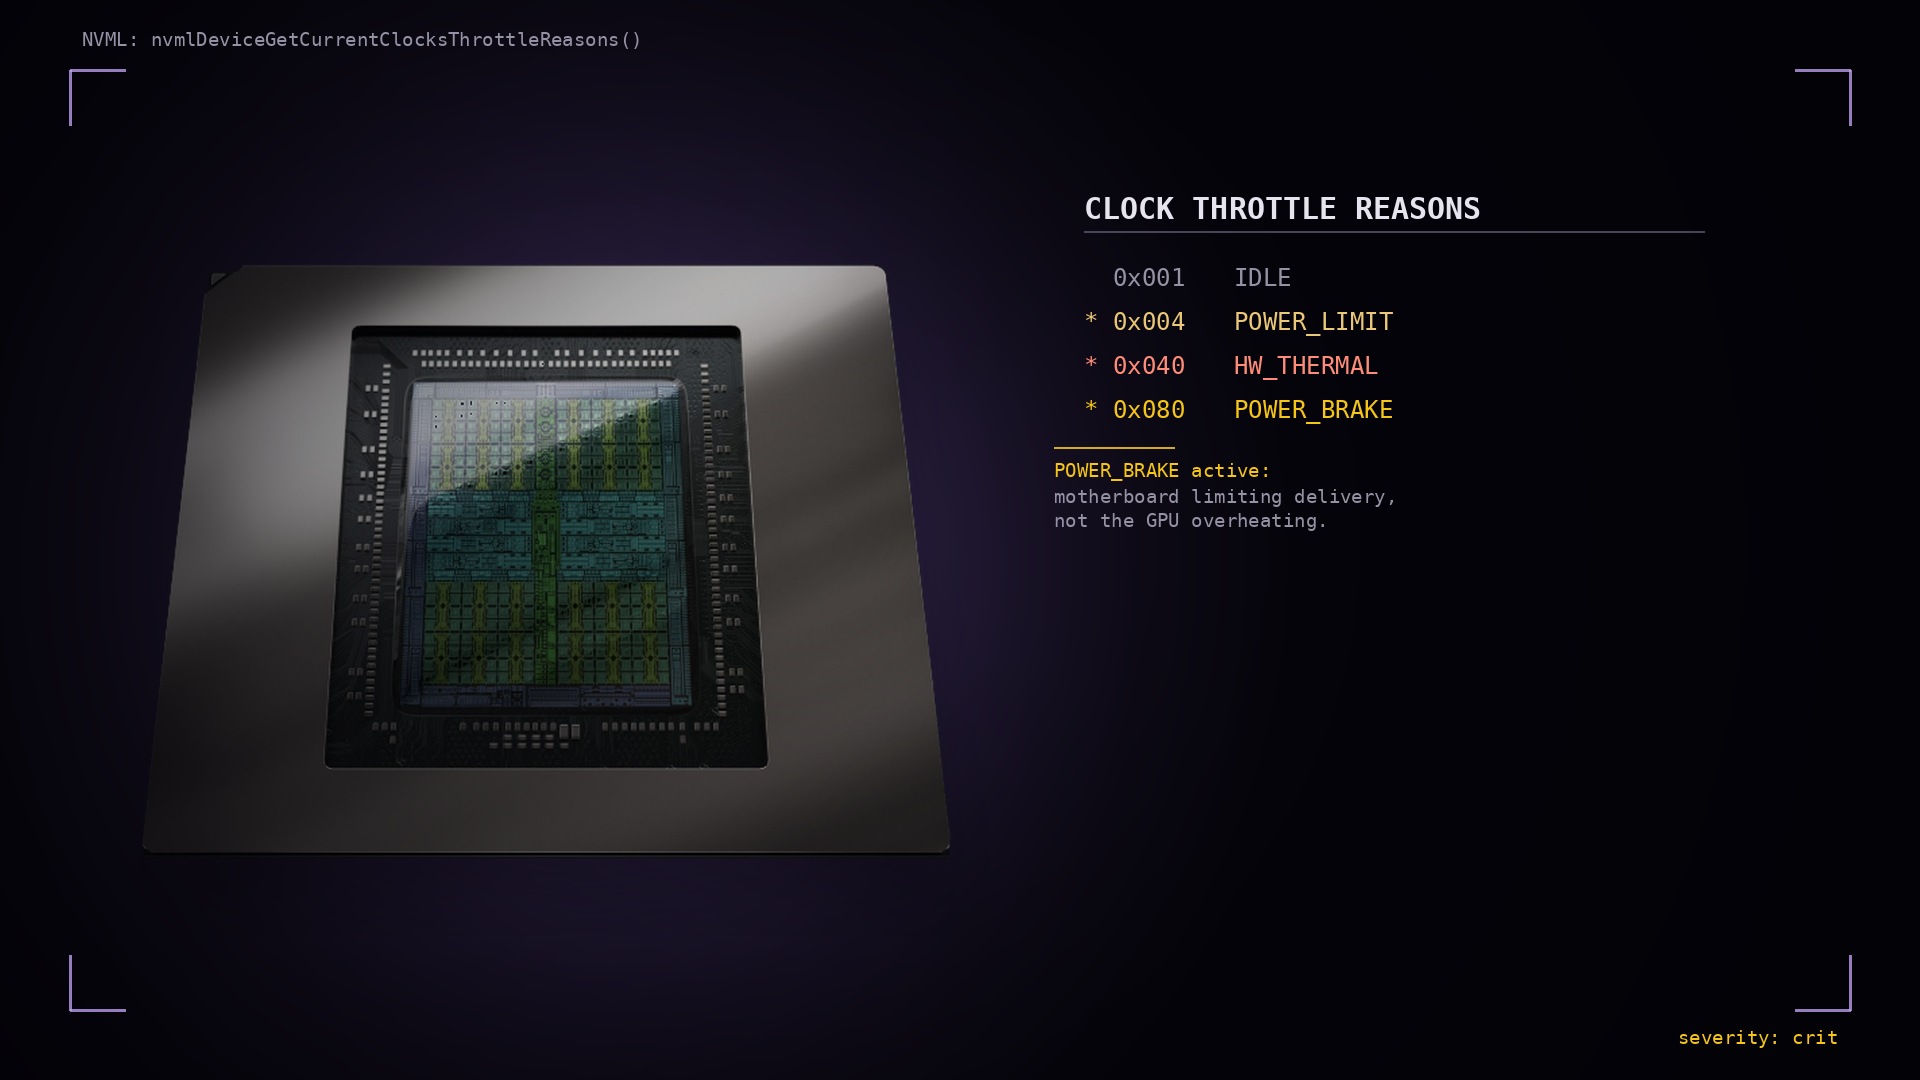
Your FPS tanked in the middle of a match, the counter just shows a lower number, and you’re left guessing: is the card cooking, is a power cap kicking in, or is your motherboard the actual bottleneck? This one is NVIDIA-only, up front, no hedging. AMD’s Linux driver doesn’t expose an equivalent bitmask, so if you’re on an AMD card, the mechanism below genuinely doesn’t exist for you yet. Read on anyway if you’re curious how NVIDIA’s side works, or skip to the honest AMD paragraph near the end.
The FPS drop tells you nothing on its own
An FPS counter, MangoHud or otherwise, tells you a number went down. It can’t tell you why: the game engine hit a CPU-bound scene, the GPU throttled from heat, a power cap kicked in, or something as mundane as the motherboard itself limiting how much power it will hand the card. Four completely different problems that look identical on a graph, and only one of them means you need better cooling.
NVIDIA already answers this, it’s just buried
NVML, NVIDIA’s management library, exposes a live bitmask called the clock throttle
reasons register. Every flag in it corresponds to one specific cause the driver is
currently reducing clocks for, read in real time via
nvmlDeviceGetCurrentClocksThrottleReasons(). Nobody surfaces this in plain English by
default, it’s a raw integer meant for driver internals and monitoring tools, not players.
Here’s the actual bitmask:
| Bit | Flag | What it means |
|---|---|---|
0x001 |
IDLE |
GPU isn’t under load, clocks dropped to save power. Not a problem. |
0x002 |
APP_CLOCK |
An app or the driver set an intentional clock cap. |
0x004 |
POWER_LIMIT |
GPU is drawing more than its configured TDP cap. |
0x008 |
HW_SLOWDOWN |
Hardware protection circuit tripped: combined thermal and power. |
0x010 |
SYNC_BOOST |
Multi-GPU clock sync. Intentional. |
0x020 |
SW_THERMAL |
Driver reducing clocks for temperature. |
0x040 |
HW_THERMAL |
GPU is overheating. The dangerous one. |
0x080 |
POWER_BRAKE |
PCIe power brake: the motherboard is limiting power delivery. |
0x100 |
DISPLAY_CLK |
Clocks constrained by the current display output. |
The one almost nobody checks: POWER_BRAKE
Most people who go looking for a throttle explanation are hunting for heat. Fair, since
HW_THERMAL (0x040, the GPU actually overheating) is real and common. But POWER_BRAKE
(0x080) is the one that surprises people: it fires when the motherboard, not the GPU,
is limiting how much power gets delivered through the PCIe slot. A hot GPU and a
power-starved GPU produce the same symptom, lower clocks, worse frame times, but they
have nothing in common as root causes. One is a cooling problem. The other is a PSU or
motherboard power-delivery problem, and no amount of repasting or better airflow fixes
it.
Which bits actually count as throttling
Not every set bit means something went wrong. IDLE, APP_CLOCK, SYNC_BOOST, and
DISPLAY_CLK are intentional or benign, the GPU behaving exactly as designed. The bits
that represent real performance impact are HW_THERMAL, SW_THERMAL, POWER_LIMIT,
POWER_BRAKE, and HW_SLOWDOWN. Multiple bits can be set at once (a hot GPU that’s also
hitting its power cap is common under sustained load), which is exactly why a single FPS
number can’t distinguish these cases and a raw bitmask read can.
What Thermal Canary Pro’s Throttle Detector does with it
The Throttle Detector reads that bitmask on a timer and turns it into one plain-English
line instead of a hex value: a hot GPU reads “GPU is overheating: clocks reduced to
protect hardware,” a motherboard power brake reads “Motherboard is limiting power
delivery via PCIe power brake,” and so on for every flag above. When multiple real
throttling bits are active at once, it reports all of them, not just the first match, so
“thermal and power-limited at the same time” doesn’t get silently collapsed into just
one cause. Benign flags like IDLE or SYNC_BOOST are shown as context, not flagged as
a problem.
MangoHud already does an excellent job putting FPS and raw sensor numbers on screen during a game, and Pro bundles MangoHud itself rather than replacing it. This is a different layer: MangoHud shows you the number, Throttle Detector answers the “why” underneath it.
The honest AMD paragraph
AMD’s Linux driver (amdgpu) does not expose an equivalent throttle-reason bitmask
today. There’s no public interface that hands back “here’s specifically why your AMD
GPU throttled” the way NVML does for NVIDIA. That’s a driver and API gap, not a choice
made by this app, the same kind of asymmetry as AMD exposing GPU junction temperature
over amdgpu while NVIDIA’s NVML doesn’t expose junction temperature at all. Different
vendors, different blind spots. If that changes, this feature extends to cover it.